The line y = 3x + 2 is tangent to the graph of the function y = -12x ^ 2 + bx-10. Find b, given that the abscissa of the touch point is less than zero.
Show solutionSolution
Let x_0 be the abscissa of the point on the graph of the function y = -12x ^ 2 + bx-10, through which the tangent to this graph passes.
The value of the derivative at the point x_0 is equal to the slope of the tangent, that is, y "(x_0) = - 24x_0 + b = 3. On the other hand, the tangent point belongs to both the graph of the function and the tangent, that is, -12x_0 ^ 2 + bx_0-10 = 3x_0 + 2. We get the system of equations \ begin (cases) -24x_0 + b = 3, \\ - 12x_0 ^ 2 + bx_0-10 = 3x_0 + 2. \ end (cases)
Solving this system, we get x_0 ^ 2 = 1, which means either x_0 = -1, or x_0 = 1. According to the condition, the abscissa of the touch point is less than zero, therefore x_0 = -1, then b = 3 + 24x_0 = -21.
Answer
Condition
The figure shows the graph of the function y = f (x) (which is a broken line made up of three straight line segments). Using the figure, calculate F (9) -F (5), where F (x) is one of the antiderivatives of f (x).
Show solutionSolution
According to the Newton-Leibniz formula, the difference F (9) -F (5), where F (x) is one of the antiderivatives of the function f (x), is equal to the area of the curvilinear trapezoid bounded by the graph of the function y = f (x), by the straight lines y = 0 , x = 9 and x = 5. According to the graph, we determine that the indicated curved trapezoid is a trapezoid with bases equal to 4 and 3 and a height of 3.
Its area is \ frac (4 + 3) (2) \ cdot 3 = 10.5.
Answer
Source: “Mathematics. Preparation for the exam-2017. Profile level ". Ed. FF Lysenko, S. Yu. Kulabukhova.
Condition
The figure shows the graph of y = f "(x) - the derivative of the function f (x), defined on the interval (-4; 10). Find the intervals of decrease of the function f (x). In the answer, indicate the length of the largest of them.

Solution
As you know, the function f (x) decreases on those intervals, at each point of which the derivative f "(x) is less than zero. Taking into account that it is necessary to find the length of the largest of them, three such intervals are naturally distinguished from the figure: (-4; -2) ; (0; 3); (5; 9).
The length of the largest of them - (5; 9) is equal to 4.
Answer
Source: “Mathematics. Preparation for the exam-2017. Profile level ". Ed. FF Lysenko, S. Yu. Kulabukhova.
Condition
The figure shows the graph of y = f "(x) - the derivative of the function f (x), defined on the interval (-8; 7). Find the number of maximum points of the function f (x) belonging to the interval [-6; -2].
.png)
Solution
The graph shows that the derivative f "(x) of the function f (x) changes sign from plus to minus (it is at such points that there will be a maximum) at exactly one point (between -5 and -4) from the interval [-6; -2 ]. Therefore, there is exactly one maximum point on the interval [-6; -2].
Answer
Source: “Mathematics. Preparation for the exam-2017. Profile level ". Ed. FF Lysenko, S. Yu. Kulabukhova.
Condition
The figure shows the graph of the function y = f (x), defined on the interval (-2; 8). Determine the number of points at which the derivative of the function f (x) is 0.

Solution
The equality to zero of the derivative at a point means that the tangent to the graph of the function, drawn at this point, is parallel to the Ox axis. Therefore, we find points at which the tangent to the graph of the function is parallel to the Ox axis. On this chart, such points are extreme points (points of maximum or minimum). As you can see, there are 5 extremum points.
Answer
Source: “Mathematics. Preparation for the exam-2017. Profile level ". Ed. FF Lysenko, S. Yu. Kulabukhova.
Condition
The line y = -3x + 4 is parallel to the tangent to the graph of the function y = -x ^ 2 + 5x-7. Find the abscissa of the touch point.
Show solutionSolution
The slope of the straight line to the graph of the function y = -x ^ 2 + 5x-7 at an arbitrary point x_0 is equal to y "(x_0). But y" = - 2x + 5, so y "(x_0) = - 2x_0 + 5. Angular the coefficient of the straight line y = -3x + 4, specified in the condition, is equal to -3. Parallel lines have the same slope. Therefore, we find such a value of x_0 that = -2x_0 + 5 = -3.
We get: x_0 = 4.
Answer
Source: “Mathematics. Preparation for the exam-2017. Profile level ". Ed. FF Lysenko, S. Yu. Kulabukhova.
Condition
The figure shows the graph of the function y = f (x) and the points -6, -1, 1, 4 are marked on the abscissa axis. At which of these points is the value of the derivative the smallest? Indicate this point in your answer.
Master class in mathematics
in grade 11
on this topic
"DERIVATIVE FUNCTION
IN THE TASKS OF THE USE "
mathematic teacher
Martynenko E.N.
2017-2018 academic year
The purpose of the master - class: develop students' skillsapplication of theoretical knowledge on the topic "Derivative of the function" for solving the problems of the unified state examination.
Tasks
Educational:to summarize and systematize the knowledge of students on the topic
"Derivative of a function", consider the prototypes of the USE problems on this topic, provide students with the opportunity to test their knowledge when solving problems on their own.
Developing: promote the development of memory, attention, self-esteem and self-control skills; the formation of basic key competencies (comparison, juxtaposition, classification of objects, determination of adequate ways to solve an educational problem based on specified algorithms, the ability to act independently in a situation of uncertainty, to control and evaluate their activities, to find and eliminate the causes of difficulties that have arisen).
Educational: promote:
Formation of a responsible attitude towards learning among students;
developing a sustained interest in mathematics;
creating a positive intrinsic motivation to study mathematics.
Technologies : individually differentiated learning, ICT.
Teaching methods : verbal, visual, practical, problematic.
Forms of work: individual, frontal, in pairs.
Equipment and materials for the lesson:projector, screen, PC, simulator(Appendix # 1), presentation for the lesson(Appendix # 2), individually - differentiated cards for independent work in pairs(Appendix No. 3), list of Internet sites, individually differentiated homework(Appendix # 4).
Explanation for the master class.
This master class is held in grade 11 to prepare for the Unified State Exam. Aims at the application of theoretical material on the topic "Derivative of a function" in solving exam problems.
Duration of the master class- 20 minutes.
Master class structure
I. Organizational moment -1 min.
II. Communication of the topic, the goals of the master - class, motivation of educational activities - 1 min.
III. Frontal work. Training "Tasks No. 14 BASE, No. 7 PROFILE of the Unified State Exam". Analysis of work with the simulator - 7 min.
IV.Individually - differentiated work in pairs. Independent solution of problems No. 12. (PROFILE) Mutual check - 9 min. On - line testing. (BASE) Analysis of test results - 8 min
V. Checking individual homework. -1 minute.
Vi. Individually - differentiated homework -1 min.
Vii. CONTROL TEST 20 MINUTES (4 OPTIONS)
Master class progress
I .Organizing time.
II . Communication of the topic, the goals of the master - class, motivation of educational activities.
(Slides 1-2, Appendix # 2)
The topic of our lesson is "The derivative of a function in the tasks of the exam". Everyone knows the saying “Small spool but dear”. One of such “spools” in mathematics is the derivative. The derivative is used in solving many practical problems in mathematics, physics, chemistry, economics and other disciplines. It allows you to solve problems simply, beautifully, and interestingly.
The topic "Derivative" is presented in the task No. 14 of the basic level and in the tasks of the profile level No. 7,12, 18 and the unified state exam.
You worked with documents regulating the structure and content of control measuring materials of the unified state exam in mathematics 2018. Make a conclusion about what knowledge and skills you need to successfully solve the USE problems on the topic "Derivative".
(Slides 3-4, Appendix # 2)
Have you learned "Codifier of the elements of content in MATHEMATICS for the preparation of control measuring materials for the unified state examination",
"Codifier of requirements for the level of training of graduates", "Specification of control measuring materials", "Demonstration version of control measuring materials of the unified state exam 2018" and found out what knowledge and skills about the function and its derivative are needed to successfully solve problems on the topic "Derivative".
Necessary
- KNOW
derivative calculation rules;
derivatives of basic elementary functions;
the geometric and physical meaning of the derivative;
equation of the tangent to the graph of the function;
study of a function using a derivative.
- BE ABLE TO
perform actions with functions (describe the behavior and properties of a function according to the graph, find its highest and lowest values).
- USE
acquired knowledge and skills in practice and everyday life.
You have theoretical knowledge of the Derivative topic. Today we willLEARN TO APPLY KNOWLEDGE ABOUT THE DERIVATIVE FUNCTION TO SOLVE THE USE PROBLEMS.(Slide 4, Appendix No. 2)
It's not for nothing Aristotle said that“THE MIND IS NOT ONLY IN KNOWLEDGE, BUT ALSO IN THE ABILITY TO APPLY KNOWLEDGE IN PRACTICE”(Slide 5, Appendix No. 2)
At the end of the lesson, we will return to the goal of our lesson and find out if we have achieved it?
III ... Frontal work.Training "Tasks No. 14 BASE No. 7 PROFILE of the Unified State Exam" ( Appendix No. 1). Analysis of work with the simulator.
Choose the correct answer from the four suggested.
What, in your opinion, is the difficulty of completing task # 7?
What do you think, what are the typical mistakes graduates make on the exam when solving this problem?
When answering the questions of task No. 14 BASE AND No. 7 PROFILE, you must be able to describe the behavior and properties of the function from the graph of the derivative, and from the graph of the function - the behavior and properties of the derivative of the function. And this requires good theoretical knowledge on the following topics: “Geometric and mechanical meaning of the derivative. Tangent to the graph of the function. Application of the derivative to the study of functions ”.
Analyze what tasks caused you difficulties?
What theoretical questions do you need to know?
IV. Оn - line testing on assignments №14 (BASE)Analysis of test results.
Site for testing in the lesson:http://www.mathb-ege.sdamgia.ru/
Who has not made mistakes?
Who experienced difficulty in testing? Why?
In what tasks were mistakes made?
Conclude, what theoretical questions do you need to know?
Individually - differentiated work in pairs. Independent solution of problems №12. (PROFILE)Mutual verification.(Appendix # 3)
Remember the algorithm for solving problems №12 of the exam for finding extremum points, extrema of a function, the largest and smallest values of a function on the interval using the derivative.
Solve problems with a derivative
The students are faced with a problem:
"Think, is it possible to solve some problems # 12 in a different way, without using a derivative?"
1 pair
2 pair
3 pair
4 pair
(Students defend their solution by writing the main steps for solving problems on the chalkboard. Students provide two ways to solve problem # 2).
Solution of a problem. Conclusion for students:
"Some problems No. 12 of the exam for finding the smallest and largest value of a function can be solved without using the derivative, relying on the properties of the functions."
Analyze what mistake you made in the task?
What theoretical questions do you need to repeat?
V. Checking individual homework. (Slides 7-8, Appendix No. 2)
Vegelman V. was given individual homework: from the manuals for preparing for the exam number 18.
(The student gives the solution to the problem, relying on the functional-graphic method, as one of the methods for solving problems No. 18 of the exam and gives a short explanation of this method).
Vii. Individually - differentiated homework
(Slide 9, Appendix No. 2), (Appendix # 4).
I have prepared a list of Internet sites to prepare for the exam. You can also take online testing on these sites. For the next lesson, you need to: 1) review the theoretical material on the topic "Derivative of a function";
2) on the site "Open bank of tasks in mathematics" (http://mathege.ru/ ) find prototypes of tasks No. 14 BASE AND No. 7 and 12 PROFILE and solve at least 10 problems PROFILE;
3) V. Vegelman, solve problems with parameters (APPENDIX 4). tasks 1-8 (option 1).A BASIC LEVEL OF
VIII. Lesson grades.
How would you rate yourself for a lesson?
Do you think you could have done better in the lesson?
IX. Lesson summary. Reflection
Let's summarize our work. What was the purpose of the lesson? Do you think it has been achieved?
Look at the board and in one sentence, choosing the beginning of the phrase, continue with the sentence that suits you best.
I felt…
I learned…
I managed …
I was able to ...
I'll try …
I was surprised that …
I wanted…
Can you say that during the lesson there was an enrichment of your stock of knowledge?
So, you repeated the theoretical questions about the derivative of the function, applied your knowledge in solving the prototypes of the USE tasks (No. 14 BASIC LEVEL No. 7,12 PROFILE LEVEL), and V. Vegelman completed the task No. 18 with a parameter, which is a task of an increased degree difficulties.
It was a pleasure for me to work with you, and I hope that you will be able to successfully apply the knowledge gained in mathematics lessons not only when passing the Unified State Exam, but also in your further studies.
I would like to end the lesson with the words of an Italian philosopherThomas Aquinas"Knowledge is such a precious thing that it is not shameful to get it from any source."(Slide 10, Appendix # 2).
I wish you success in preparing for the exam!
Preview:
To use the preview of presentations, create yourself a Google account (account) and log into it: https://accounts.google.com
Slide captions:
Preparing for the exam SIMULATOR on the topic "Derivative" Task number 14 basic level, number 7, 12 profile level
f (x) f / (x) x The figure shows the graph of the derivative of the function y = f (x), specified on the interval (- 8; 8). Let's explore the properties of the graph and we will be able to answer many questions about the properties of the function, although the graph of the function itself is not presented! y = f / (x) 1 2 3 4 5 6 7 -7 -6 -5 -4 -3 -2 -1 4 3 2 1 -1 -2 -3 -4 -5 yx 6 3 0 -5 Find points where f / (x) = 0 (these are the zeros of the function). + - - + +
ASSIGNMENT number 14 Mathematics basic level
The figure shows the graph of the function y = f (x) and the points A, B, C and D are marked on the Ox axis. Using the graph, assign to each point the characteristics of the function and its derivative. ABCD 1) the value of the function at the point is negative, and the value of the derivative of the function at the point is positive 2) the value of the function at the point is positive, and the value of the derivative of the function at the point is negative 3) the value of the function at the point is negative, and the value of the derivative of the function at the point is negative 4) the value of the function at the point is positive, and the value of the derivative of the function at the point is positive
№ 1 The figure shows the graph of the function y = f (x) and marked points A, B, C and D on the Ox axis. Using the graph, assign to each point the characteristics of the function and its derivative. 1) the value of the function at the point is positive, and the value of the derivative of the function at the point is negative 2) the value of the function at the point is negative, and the value of the derivative of the function at the point is negative 3) the value of the function at the point is positive, and the value of the derivative of the function at the point is positive 4) the value of the function at the point is negative, and the value of the derivative of the function at the point is positive ABCD
The figure shows the graph of the function y = f (x). Points a, b, c, d, and e define intervals on the Ox axis. Using the graph, assign to each interval the characteristic of the function or its derivative. A) (a; b) B) (b; c) C) (c; d) D) (d; e) 1) the values of the function are positive at each point of the interval 2) the values of the derivative of the function are negative at each point of the interval 3) the values derivative of the function are positive at each point of the interval 4) the values of the function are negative at each point of the interval
The figure shows the graph of the function y = f (x). The numbers a, b, c, d and e define the intervals on the Ox axis. Using the graph, assign to each interval the characteristic of the function or its derivative. A) (a; b) B) (b; c) C) (c; d) D) (d; e) 1) the values of the function are positive at each point of the interval 2) the values of the function are negative at each point of the interval 3) the values of the derivative functions are negative at each point of the interval 4) the values of the derivative of the function are positive at each point of the interval
The figure shows a graph of a function and tangents drawn to it at points with abscissas A, B, C and D. A B C D 1) - 1.5 2) 0.5 3) 2 4) - 0.3
The figure shows a graph of a function and tangents drawn to it at points with abscissas A, B, C and D. A B C D 1) 23 2) - 12 3) - 113 4) 123
ASSIGNMENT number 7 Mathematics profile level
Problems for the geometric meaning of the derivative
1) The figure shows the graph of the function y = f (x) and the tangent to it at the point with the abscissa x 0. Find the value of the derivative at the point x 0. -2 -0.5 2 0.5 Think! Think! Right! Think! x 0 Geometric meaning of the derivative: k = tg α The angle of inclination of the tangent to the Ox axis is obtuse, so k
5 11 8 2) The continuous function y = f (x) is set on the interval (-6; 7). The figure shows her graph. Find the number of points at which the tangent to the graph of the function is parallel to the straight line y = 6. Checking y = f (x) y x 3 Think! Think! Think! Right! - 6 7 y = 6. Breakpoint. The derivative does NOT exist at this point! О -4 3 5 1, 5
Tasks for determining the characteristics of a function from the graph of its derivative
3) The figure shows the graph of the derivative of the function y = f / (x), given on the interval (- 6; 8). Examine the function y = f (x) for extremum and indicate the number of its extremum points. 2 1 4 5 Wrong! Not true! Right! Not true! Check (2) f (x) f / (x) -2 + - y = f / (x) 1 2 3 4 5 6 7 -7 -6 -5 -4 -3 -2 -1 4 3 2 1 - 1 -2 -3 -4 -5 yx -5 + min max О
4 -3 -2 -1 1 2 3 4 5 x 5) The figure shows the graph of the derivative of a function specified in the interval [-5; 5]. Examine the function for monotonicity and indicate the largest maximum point. 3 2 4 5 Think! Think! Right! Think! y = f / (x) + + + - - О - f / (x) - + - + - + f (x) -4 -2 0 3 4 Of the two maximum points, the largest x max = 3 max max y
7) The figure shows the graph of the derivative of the function. Find the length of the increasing interval of this function. Check O -7 -6 -5 -4 -3 -2 -1 7 6 5 4 3 2 1 -1 -2 -3 -4 -5 -6 -7 4 2 3 5 THINK! + THINK! RIGHT! THINK! y x 3 y = f / (x)
4 -3 -2 -1 1 2 3 4 5 x 6) The figure shows the graph of the derivative of a function set in the interval [-5; 5]. Examine the function y = f (x) for monotonicity and indicate the number of intervals of decrease. 3 2 4 1 Think! Think! Right! Think! y = f / (x) f (x) -4 -2 0 4 f / (x) - + - + - + + О - - - y
Tasks for determining the characteristics of a graph derivative of a function.
The figure shows the graph of the differentiable function y = f (x). Nine points are marked on the abscissa: x 1, x 2, ..., x 9. Find all marked points at which the derivative of the function f (x) is negative. In the answer, indicate the number of these points.
The figure shows the graph of the function y = f (x), defined on the interval (a; b). Determine the number of integer points at which the derivative of the function is positive. a) b) Decide for yourself! Solution. if it increases. Whole solutions for: x = -2; x = -1; x = 5; x = 6. Their number is 4. Whole solutions for: x = 2; x = 3; x = 4; x = 10; x = 11. Their number is 5. Answer: 4. Answer: 5.
Problems for the physical meaning of the derivative
Answer: 3 Answer: 14
ASSIGNMENT number 12 Mathematics profile level
Independent work in pairs Task number 12 Profile level
Preview:
Appendix 3 individual cards No. 12
1. Find the maximum point of the function1 Find the minimum point of the function
2.Find the maximum point of the function 2Find the minimum point of the function
Linnik D. Vovnenko I
1.Find the smallest value of the function 1. Find the largest value of the function
 on the segment
on the segment 


Vegelman V.
A.
1. Find the maximum point of the function 1. Find the minimum point of the function
2. Find the smallest value of the function 2. Find the largest value of the function
 on the segment
On the segment 
Leontyeva A. Isaenko K.
OUT-OF-AUDIT PRACTICE 2
Convert function graphs.
Target
Construct graphs of functions using various transformations, answer the question of the problem.
Completing of the work
Methodical instructions
The work is designed for 10 variants, the variant number coincides with the last digit of the serial number in the list. For example, 1, 11, 21, 31 ... perform 1 option, 2,12, 22 ... - 2 option, etc.
The work consists of two parts: the first part of the task 1 - 5, these are tasks that must be completed in order to get a credit, if these tasks are completed with an error, they must be corrected and the work must be submitted again for verification. The second part contains tasks, by completing which you can earn an additional grade: the main part +2 tasks - "4", the main part +3 tasks - "5".
Task 1. The graph of a linear function is a straight line; two points are enough to plot it. (we take the values of the argument x arbitrarily, and the value of the function y, we count by substituting it into the formula).
To check whether the graph of the function passes through the specified point, you need to substitute the coordinates of the point instead of x and y, if you get the correct equality, then the straight line passes through the specified point, otherwise it does not.
Task 2, 3, 4. The graphs of the specified functions are obtained from the graphs of the functions , using a shift along the x or y axis.
![]() , first we plot the function or , then we shift it by "a" units to the right or left (+ a - to the left, - and to the right), then we shift it by "c" units up or down (+ b - up, -b - down)
, first we plot the function or , then we shift it by "a" units to the right or left (+ a - to the left, - and to the right), then we shift it by "c" units up or down (+ b - up, -b - down)
Likewise with other functions:
Task 5 To plot a function graph: , you need to: 1) plot the function , 2) leave the part of the graph that is above the x-axis unchanged, 3) mirrored the part of the graph that is below the x-axis.
Tasks for an independent solution.
Mandatory part
Task 1. Plot a graph of a linear function, determine if the graph of the function passes through the specified point:

Task 2. Plot a graph of a quadratic function, specify the set of values for this function.

Task 3. Build a graph of the function, determine whether the specified function increases or decreases.

Task 4. Build a graph of the function, answer the question of the problem.

Task 5. Plot the graph of the function containing the modulus sign.

Tasks for additional assessment.
Task 6. Plot a graph of a function given piecewise, determine if there is a break point for this function:


Task 7. Determine how many solutions the system of equations has, the answer is to justify. Draw conclusions by answering the questions.
What functions have you plotted in this work?
What is the name of the graph of a linear function?
What is the name of the graph of a quadratic function?
What graph transformations do you know?
How is the graph of an even function located in the coordinate system? Odd function graph?
The derivative of the function $ y = f (x) $ at a given point $ x_0 $ is the limit of the ratio of the increment of the function to the corresponding increment of its argument, provided that the latter tends to zero:
$ f "(x_0) = (lim) ↙ (△ x → 0) (△ f (x_0)) / (△ x) $
Differentiation is the operation of finding a derivative.
Derivative table of some elementary functions
| Function | Derivative |
| $ c $ | $0$ |
| $ x $ | $1$ |
| $ x ^ n $ | $ nx ^ (n-1) $ |
| $ (1) / (x) $ | $ - (1) / (x ^ 2) $ |
| $ √x $ | $ (1) / (2√x) $ |
| $ e ^ x $ | $ e ^ x $ |
| $ lnx $ | $ (1) / (x) $ |
| $ sinx $ | $ cosx $ |
| $ cosx $ | $ -sinx $ |
| $ tgx $ | $ (1) / (cos ^ 2x) $ |
| $ ctgx $ | $ - (1) / (sin ^ 2x) $ |
Basic rules for differentiation
1. The derivative of the sum (difference) is equal to the sum (difference) of the derivatives
$ (f (x) ± g (x)) "= f" (x) ± g "(x) $
Find the Derivative of the Function $ f (x) = 3x ^ 5-cosx + (1) / (x) $
The derivative of the sum (difference) is equal to the sum (difference) of the derivatives.
$ f "(x) = (3x ^ 5)" - (cos x) "+ ((1) / (x))" = 15x ^ 4 + sinx - (1) / (x ^ 2) $
2. Derivative of the work
$ (f (x) g (x)) "= f" (x) g (x) + f (x) g (x) "$
Find the Derivative $ f (x) = 4x cosx $
$ f "(x) = (4x)" cosx + 4x (cosx) "= 4 cosx-4x sinx $
3. Derivative of the quotient
$ ((f (x)) / (g (x))) "= (f" (x) g (x) -f (x) g (x) ") / (g ^ 2 (x)) $
Find the Derivative $ f (x) = (5x ^ 5) / (e ^ x) $
$ f "(x) = ((5x ^ 5)" e ^ x-5x ^ 5 (e ^ x) ") / ((e ^ x) ^ 2) = (25x ^ 4 e ^ x- 5x ^ 5 e ^ x) / ((e ^ x) ^ 2) $
4. The derivative of a complex function is equal to the product of the derivative of the outer function by the derivative of the inner function
$ f (g (x)) "= f" (g (x)) g "(x) $
$ f "(x) = cos" (5x) · (5x) "= - sin (5x) · 5 = -5sin (5x) $
The physical meaning of the derivative
If a material point moves rectilinearly and its coordinate changes depending on time according to the law $ x (t) $, then the instantaneous speed of this point is equal to the derivative of the function.
The point moves along the coordinate line according to the law $ x (t) = 1,5t ^ 2-3t + 7 $, where $ x (t) $ is the coordinate at the time $ t $. At what point in time will the speed of the point be equal to $ 12 $?
1. Velocity is the derivative of $ x (t) $, so we find the derivative of the given function
$ v (t) = x "(t) = 1.5 · 2t -3 = 3t -3 $
2. To find at what time moment $ t $ the speed was equal to $ 12 $, compose and solve the equation:
The geometric meaning of the derivative
Recall that the equation of a straight line not parallel to the coordinate axes can be written in the form $ y = kx + b $, where $ k $ is the slope of the straight line. The coefficient $ k $ is equal to the tangent of the inclination angle between the straight line and the positive direction of the $ Ox $ axis.
The derivative of the function $ f (x) $ at the point $ x_0 $ is equal to the slope $ k $ of the tangent to the graph at this point:
Therefore, we can draw up a general equality:
$ f "(x_0) = k = tgα $
In the figure, the tangent to the function $ f (x) $ increases, therefore, the coefficient $ k> 0 $. Since $ k> 0 $, then $ f "(x_0) = tgα> 0 $. The angle $ α $ between the tangent and the positive direction $ Ox $ is acute.
In the figure, the tangent to the function $ f (x) $ decreases; therefore, the coefficient $ k< 0$, следовательно, $f"(x_0) = tgα < 0$. Угол $α$ между касательной и положительным направлением оси $Ох$ тупой.
In the figure, the tangent to the function $ f (x) $ is parallel to the $ Ox $ axis, therefore, the coefficient $ k = 0 $, therefore, $ f "(x_0) = tg α = 0 $. The point $ x_0 $ at which $ f "(x_0) = 0 $, called extreme.
The figure shows the graph of the function $ y = f (x) $ and the tangent to this graph, drawn at the point with the abscissa $ x_0 $. Find the value of the derivative of the function $ f (x) $ at the point $ x_0 $.
The tangent line to the graph increases, therefore, $ f "(x_0) = tg α> 0 $
In order to find $ f "(x_0) $, find the tangent of the inclination angle between the tangent and the positive direction of the $ Ox $ axis. To do this, add the tangent to the triangle $ ABC $.
Find the tangent of the angle $ BAC $. (The tangent of an acute angle in a right triangle is the ratio of the opposite leg to the adjacent leg.)
$ tg BAC = (BC) / (AC) = (3) / (12) = (1) / (4) = 0.25 $
$ f "(x_0) = tg BAC = 0.25 $
Answer: $ 0.25
The derivative is also used to find the intervals of increasing and decreasing functions:
If $ f "(x)> 0 $ in the interval, then the function $ f (x) $ increases in this interval.
If $ f "(x)< 0$ на промежутке, то функция $f(x)$ убывает на этом промежутке.
The figure shows the graph of the function $ y = f (x) $. Find among the points $ x_1, x_2, x_3… x_7 $ those points at which the derivative of the function is negative.
In response, write down the number of points given.
In the task number 13 of the USE in mathematics of the basic level, you will have to demonstrate the skills and knowledge of one of the concepts of the behavior of a function: derivatives at a point or rates of increase or decrease. The theory will be added to this task a little later, but this does not prevent us from analyzing in detail several typical options.
Analysis of typical options for tasks No. 14 of the USE in mathematics of the basic level
Option 14MB1
The graph shows the dependence of temperature on time during the warming up of a passenger car engine. The horizontal axis shows the time in minutes elapsed since the start of the engine; the vertical axis is the engine temperature in degrees Celsius.

Using the graph, assign to each time interval the characteristic of the engine warming up process in this interval.
In the table, under each letter, indicate the corresponding number.
Execution algorithm:
- Select the time interval during which the temperature dropped.
- Apply a ruler to 30 ° C and determine the time interval during which the temperature was below 30 ° C.
Solution:
Let us choose the time interval during which the temperature dropped. This area is visible with the naked eye, it begins 8 minutes from the moment the engine is started.
Apply a ruler to 30 ° C and determine the time interval at which the temperature was below 30 ° C.

Below the ruler there will be a section corresponding to the time interval 0 - 1 min.
Using a pencil and a ruler, we will find at what time interval the temperature was in the range from 40 ° С to 80 ° С.
Let us omit the perpendiculars from the points corresponding to 40 ° C and 80 ° C to the graph, and from the obtained points we will omit the perpendiculars to the time axis.

We see that this temperature interval corresponds to a time interval of 3 - 6.5 minutes. That is, from those given in the condition 3 - 6 minutes.
We use the elimination method to select the missing answer.
Option 14MB2
Solution:
Let's analyze the graph of the function A. If the function increases, then the derivative is positive and vice versa. The derivative of the function is equal to zero at the extremum points.
First, the function A increases, i.e. the derivative is positive. This corresponds to the graphs of derivatives 2 and 3. At the maximum point of the function x = -2, that is, at this point the derivative must be zero. This condition is met by graph number 3.
First, function B decreases, i.e. the derivative is negative. This corresponds to the graphs of derivatives 1 and 4. The maximum point of the function is x = -2, that is, at this point the derivative must be equal to zero. This condition is met by graph number 4.
First, the function B increases, i.e. the derivative is positive. This corresponds to the graphs of derivatives 2 and 3. The maximum point of the function x = 1, that is, at this point the derivative must be equal to zero. This condition is met by graph number 2.
By the method of elimination, we can determine that the graph of the function Γ corresponds to the graph of the derivative at number 1.
Answer: 3421.
Option 14MB3
Algorithm of execution for each of the functions:
- Determine the intervals of increasing and decreasing functions.
- Determine the maximum and minimum points of the functions.
- Draw conclusions, put the proposed schedules in line.
Solution:
Let's analyze the graph of the function A.
If the function is increasing, then the derivative is positive and vice versa. The derivative of the function is equal to zero at the extremum points.
The extremum point is the point at which the maximum or minimum value of a function is reached.
First, the function A increases, i.e. the derivative is positive. This corresponds to the graphs of derivatives 3 and 4. At the maximum point of the function x = 0, that is, at this point the derivative must be equal to zero. This condition is met by graph number 4.
Let us analyze the graph of the function B.
First, function B decreases, i.e. the derivative is negative. This corresponds to the graphs of derivatives 1 and 2. The minimum point of the function is x = -1, that is, at this point the derivative must be equal to zero. This condition is met by graph number 2.
Let's analyze the graph of the function B.
First, function B decreases, i.e. the derivative is negative. This corresponds to the graphs of derivatives 1 and 2. The minimum point of the function x = 0, that is, at this point the derivative must be equal to zero. This condition is met by graph number 1.
By the method of elimination, we can determine that the graph of the function Γ corresponds to the graph of the derivative at number 3.
Answer: 4213.
Option 14MB4
The figure shows a graph of a function and tangents drawn to it at points with abscissas A, B, C and D.The right column shows the values of the derivative at points A, B, C and D. Using the graph, assign to each point the value of the derivative of the function in it.

POINTS
A
V
WITH
D
THE VALUES OF THE DERIVATIVE
1) –4
2) 3
3) 2/3
4) -1/2
Let us recall what the derivative means, namely, its value at the point - the value of the derivative function at a point is equal to the tangent of the slope (coefficient) of the tangent.
In the responses, we have two positive and two negative options. As we remember, if the coefficient of a straight line (graphics y = kx + b) positive, then the straight line increases, if it is negative, then the straight line decreases.
We have two ascending straight lines - at points A and D. Now let's remember what the value of the coefficient k means?
The coefficient k shows how quickly the function increases or decreases (in fact, the coefficient k itself is the derivative of the function y = kx + b).
Therefore, k = 2/3 corresponds to a flatter line - D, and k = 3 - A.
Similarly, in the case of negative values: point B corresponds to a steeper straight line with k = - 4, and point C - -1/2.
Option 14MB5
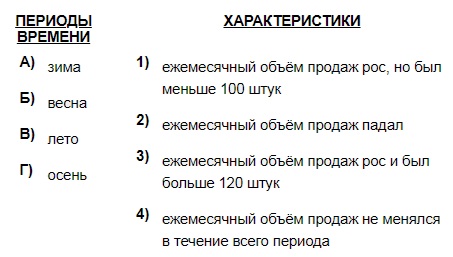
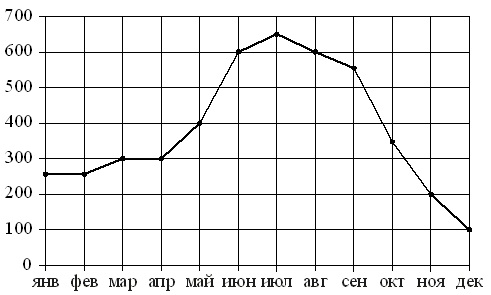
In the figure, the dots show the monthly sales of heaters in the home appliance store. Months are shown horizontally, and the number of heaters sold vertically. For clarity, the points are connected with a line.

Using the figure, match each of the indicated time periods with a sales characteristic of heaters.
Execution Algorithm
We analyze the parts of the graph corresponding to different seasons. We formulate the situations displayed on the chart. We find the most suitable answer options for them.
Solution:
In winter, the number of sales exceeded 120 pcs / month, and it was constantly increasing. This situation corresponds to answer number 3. Those. we get: A – 3.
In the spring, sales gradually fell from 120 heaters a month to 50. Option 2 is the closest to this wording. We have: B – 2.
In the summer, the number of sales did not change and was minimal. The second part of this wording is not reflected in the answers, and only # 4 is suitable for the first. Hence we have: AT 4.
In the fall, sales grew, but their number in none of the months exceeded 100 units. This situation is described in option # 1. We get: G – 1.
Option 14MB6
The graph shows the dependence of the speed of a regular bus on time. On the vertical axis the speed of the bus is marked in km / h, on the horizontal axis - the time in minutes since the beginning of the movement of the bus.
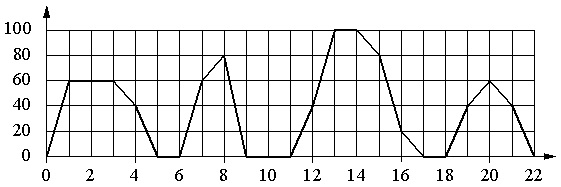
Using the graph, assign to each time interval the characteristic of the bus movement in this interval.
Execution Algorithm
- Determine the division price on the horizontal and vertical scales.
- We analyze in turn the proposed statements 1–4 from the right column ("Characteristics"). We compare them with the time intervals from the left column of the table, we find the “letter-number” pairs for the answer.
Solution:
The division on the horizontal scale is 1 s, and the vertical scale is 20 km / h.
- When the bus makes a stop, its speed is 0. The bus had zero speed for 2 minutes in a row only from the 9th to the 11th minute. This time falls within the interval of 8–12 minutes. So, we have a pair for the answer: B – 1.
- The bus had a speed of 20 km / h and more for several time intervals. Moreover, option A is not suitable here, because, for example, at the 7th minute the speed was 60 km / h, option B - because it has already been applied, option D - because at the beginning and end of the interval the bus had zero speed ... In this case, option B is suitable (12–16 min); at this interval, the bus starts moving at a speed of 40 km / h, then accelerates to 100 km / m and then gradually reduces the speed to 20 km / h. So, we have: IN 2.
- The speed limit is set here. At the same time, we do not consider options B and C. The remaining intervals A and D are both suitable. Therefore, it would be correct to consider first the 4th option, and then return to the 3rd again.
- Of the two remaining intervals, only 4–8 minutes are suitable for characteristic No. 4, since there was a stop at this interval (at the 6th minute). There were no stops in the interval of 18-22 minutes. We get: A – 4... Hence it follows that for characteristic No. 3 it is necessary to take the interval Г, i.e. it turns out a couple G – 3.
Option 14MB7
The dotted figure shows the increase in China's population from 2004 to 2013. Horizontally indicates the year, vertically - population growth as a percentage (increase in population relative to last year). For clarity, the points are connected with a line.

Using the figure, match each of the indicated periods of time with the characteristics of the growth of the population of China during this period..

Execution Algorithm
- Determine the price of division of the vertical scale of the picture. It is found as the difference between a pair of adjacent scale values, divided by 2 (since there are 2 divisions between two adjacent values).
- We analyze sequentially the characteristics 1–4 given in the condition (left table column). We compare each of them with a specific period of time (right table column).
Solution:
The vertical scale division is 0.01%.
- The decline in growth continued continuously from 2004 to 2010. In 2010–2011, the growth was stably minimal, and since 2012 it began to increase. Those. the growth stopped in 2010. This year is in the period 2009–2011. Accordingly, we have: IN 1.
- The “steepest” falling line of the chart in the figure should be considered the largest drop in growth. It falls on the period 2006-2007. and is 0.04% per year (0.59-0.56 = 0.04% in 2006 and 0.56-0.52 = 0.04% in 2007). From here we get: A – 2.
- The growth indicated in characteristic No. 3 began in 2007, continued in 2008 and ended in 2009. This corresponds to time period B, i.e. we have: B – 3.
- Population growth began to increase after 2011, i.e. in 2012–2013 Therefore, we get: G-4.
Option 14MB8
The figure shows a graph of a function and tangents drawn to it at points with abscissas A, B, C and D.

The right column shows the values of the derivative of the function at points A, B, C and D. Using the graph, assign to each point the value of the derivative of the function in it.

Execution Algorithm
- Consider a pair of tangents having an acute angle with the positive direction of the abscissa axis. We compare them, find a match among the pair of corresponding values of the derivatives.
- Consider a pair of tangents forming an obtuse angle with the positive direction of the abscissa axis. We compare them in absolute value, determine their correspondence to the values of the derivatives among the two remaining in the right column.
Solution:
An acute angle with the positive direction of the abscissa axis is formed by derivatives at point B and point C. These derivatives have positive values. Therefore, here you should choose between the values No. 1 and 3. Applying the rule that if the angle is less than 45 0, then the derivative is less than 1, and if more, then more than 1, we conclude: in point B, the derivative in modulus is greater than 1, in point C - less than 1. This means that you can make up pairs for the answer: AT 3 and С – 1.
The derivatives in point A and point D form an obtuse angle with the positive direction of the abscissa. And here we apply the same rule, paraphrasing it a little: the more the tangent at the point is "pressed" to the abscissa line (to its negative direction), the greater it is in absolute value. Then we get: the derivative in point A is less in absolute value than the derivative in point D. Hence we have pairs for the answer: A – 2 and D – 4.
Option 14MB9
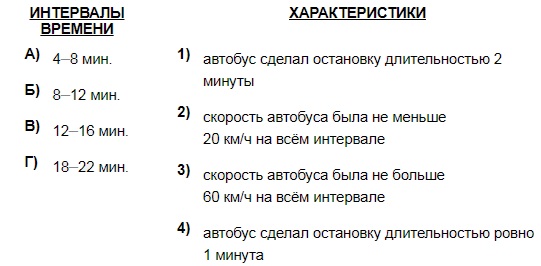
In the figure, the dots show the average daily air temperature in Moscow in January 2011. Horizontally indicates the day of the month, vertically - the temperature in degrees Celsius. For clarity, the points are connected with a line.

Using the figure, match each of the indicated periods of time with the characteristic of the temperature change.
Execution Algorithm
We analyze sequentially characteristics 1-4 (right column), using the graph in the figure. We put each of them in correspondence with a specific time period (left column).
Solution:
- An increase in temperature was observed only at the end of the period on January 22–28. Here on the 27th and 28th, it increased by 1 and 2 degrees, respectively. At the end of the period on January 1–7, the temperature was stable (–10 degrees), at the end of January 8–14 and 15–21, it decreased (from –1 to –2 and from –11 to –12 degrees, respectively). Therefore, we get: G – 1.
- Since each time period covers 7 days, the temperature needs to be analyzed starting from the 4th day of each period. The temperature remained unchanged for 3-4 days only from 4 to 7 January. Therefore, we get the answer: A – 2.
- The monthly minimum temperature was observed on January 17. This number is in the period 15-21 January. From here we have a pair: AT 3.
- The temperature maximum fell on January 10 and amounted to +1 degrees. This date falls between January 8-14. Hence, we have: B – 4.
Option 14MB10
Execution Algorithm
- The value of the function at a point is positive if this point is located above the Ox axis.
- The derivative at a point is greater than zero if the tangent to this point forms an acute angle with the positive direction of the Ox axis.
Solution:
Point A. It is below the Ox axis, which means that the value of the function in it is negative. If you draw a tangent in it, then the angle between it and the positive direction Ox will be about 90 0, i.e. forms an acute angle. So, in this case, characteristic number 3 is suitable. Those. we have: A – 3.
Point B. It is located above the Ox axis, i.e. point has a positive function value. The tangent line at this point will be quite close to the abscissa axis, forming an obtuse angle (slightly less than 180 0) with its positive direction. Accordingly, the derivative at this point is negative. Thus, characteristic 1 is suitable here. We get the answer: IN 1.
Point C. The point is located below the Ox axis, the tangent in it forms a large obtuse angle with the positive direction of the abscissa axis. Those. in point C, the value of both the function and the derivative is negative, which corresponds to characteristic No. 2. Answer: C – 2.
Point D. The point is above the Ox axis, and the tangent in it forms an acute angle with the positive direction of the axis. This suggests that both the value of the function and the value of the derivative are greater than zero here. Answer: D – 4.
Option 14MB11
In the figure, the dots show the monthly sales of refrigerators in the home appliance store. Months are displayed horizontally, and the number of refrigerators sold vertically. For clarity, the points are connected with a line.
Using the figure, match each of the indicated time periods with a sales characteristic of refrigerators..


